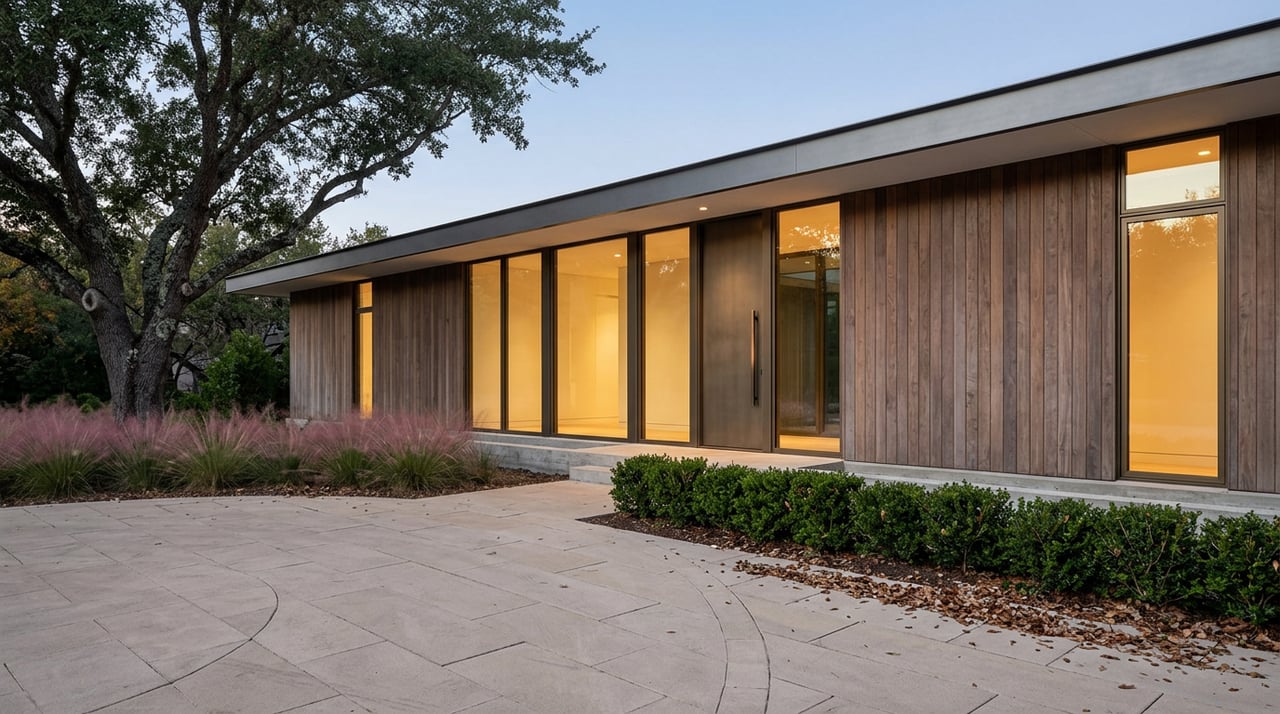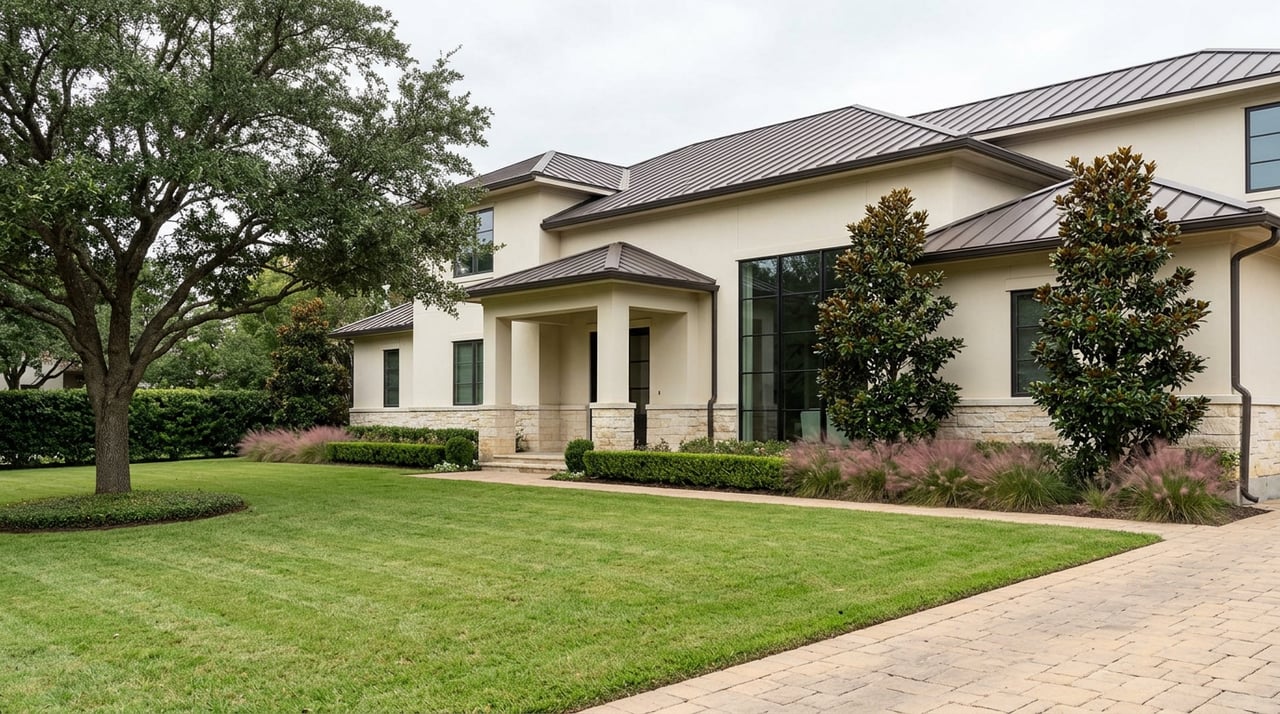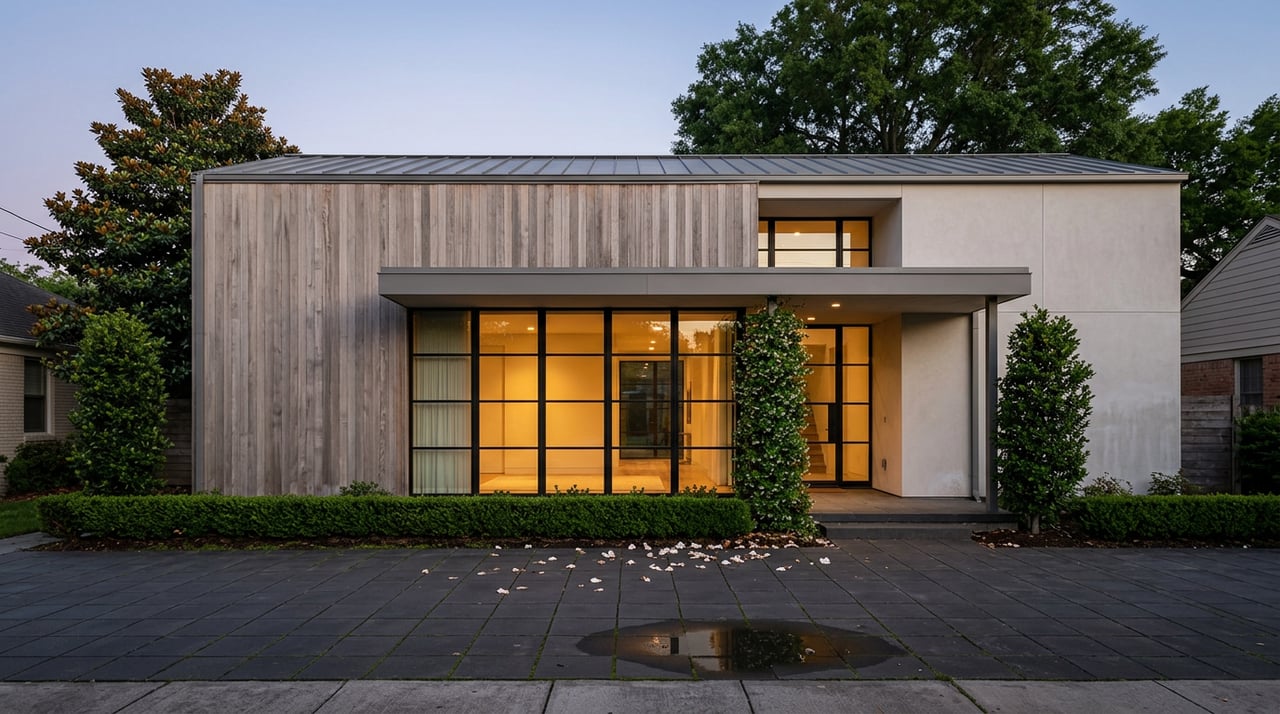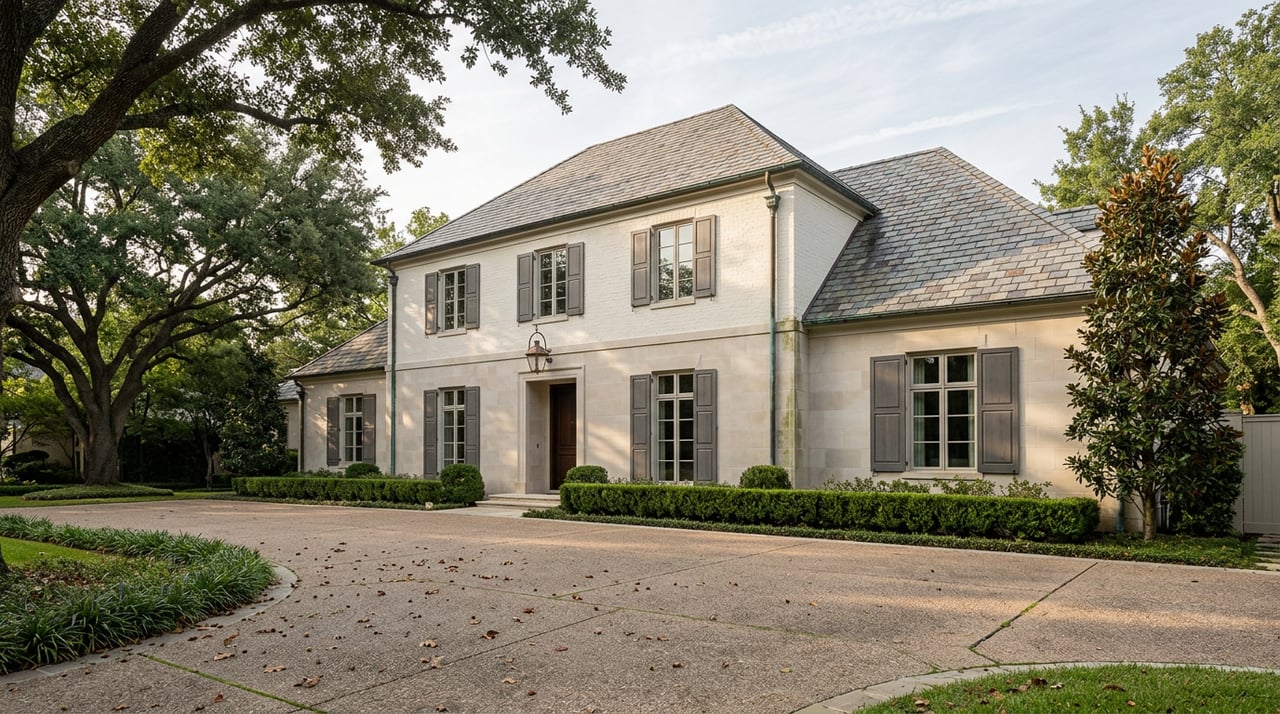
Six miles west of downtown, on a 1.19-acre lot behind Tanglewood's tree-lined streets, one address has quietly said more about this market than any headline number could. The Jack Preston Wood-designed estate at 5412 Sturbridge Drive first came to market near $11 million in the fall of 2023, marketed with a private theater and cascading pools that one of its listing agents told the Houston Chronicle made the property feel like a resort. It sat. The price dropped to $8,995,000. It sat longer. By 2026, HAR listing records showed the ask down to $6,999,999, a nearly $4 million retreat from the original number over close to three years, on a home HAR itself describes as the largest estate ever offered in Tanglewood.
That is not a story about one unlucky listing. It is the clearest evidence of a mechanism that the neighborhood's median price cannot show you, and it matters if you are pricing a Tanglewood home to sell or deciding what leverage you actually have as a buyer.
Two readings of the same twelve months
Pull up Tanglewood's numbers on two different days and you can walk away with opposite conclusions. One trailing 12-month read puts the median sale price at $2,175,000, down 17 percent from the prior year. A separate read, covering a similar window, puts it at $2,815,500, up 15 percent year over year. A third source, tracking active listings rather than closings, lists the median around $2.24 million with an average price of $570 per square foot and 85 days on market. Redfin's figure for the neighborhood's median luxury listing price sits closer to $2.7 million.
None of these are wrong. Tanglewood closes a small number of homes in any given month, which means the median is only ever as stable as whichever handful of houses happened to change hands that quarter. A $2.1 million updated ranch and an $8 million estate closing in the same reporting window can swing the reported median by hundreds of thousands of dollars without a single thing changing about underlying demand. In a market with hundreds of monthly closings, one house barely moves the needle. In Tanglewood, one house is a meaningful share of the sample.
That volatility is worth remembering before anyone, buyer or seller, anchors a decision to a single quoted median.
The number that actually moves
If the median is noisy, the more reliable signal sits one layer down, in the relationship between active listings and genuinely new ones. As of a mid-2026 snapshot, Tanglewood carried 28 active listings, up 16.7 percent from a year earlier. That sounds like rising supply. But only three new listings had entered the market in the same window, down 81.3 percent year over year. Average days on market had climbed to 100. And the asking price per square foot on new listings had actually fallen, down to roughly $494 despite an average new-listing price near $3.69 million.
Read together, those four numbers describe something more specific than "more homes for sale." They describe an inventory that is aging in place. Sellers who listed a year ago are still there, repricing and relisting, while very few new sellers are choosing to test the market. Growing active-listing counts in that context are not a sign of a busier market. They are a sign of a stuck one, concentrated at the top.
| Metric | Reading | Window |
|---|---|---|
| Active listings | 28, up 16.7% year over year | Mid-2026 snapshot |
| New listings entering market | 3, down 81.3% year over year | Same snapshot |
| Average days on market | 100 | Same snapshot |
| New-listing asking price per sq ft | ~$494 | Same snapshot |
| Median sale price, trailing 12 months | $2,175,000, down 17% | One trailing-12-month read |
| Median sale price, trailing 12 months | $2,815,500, up 15% | Separate trailing-12-month read |
| Median listing price | ~$2.24M, $570/sq ft, 85 days on market | Listing-level snapshot |
What the estate-tier cuts actually teach a buyer
Sturbridge Drive is the clean example because its price history is fully public, but it is not the only one. Another Tanglewood estate, on nearly 50,000 square feet across a double lot on Bordley Drive, followed a different path. It underwent a documented $1.5 million renovation completed in 2021, updating kitchen, gym, and outdoor systems rather than resting on architectural pedigree alone. That distinction matters. A trophy home built around a singular design vision, however striking, is a harder resale than a large, recently updated property with flexible land. Buyers negotiating at the $5 million-plus tier in Tanglewood should expect the biggest price flexibility on architecturally distinctive estates that have been on the market the longest, and the least flexibility on properties with recent, documented capital improvements and larger lots.
That is the practical translation of the 36 percent total discount on Sturbridge Drive. It is not proof that every Tanglewood estate is overpriced by a third. It is proof that pricing at this tier has been detached from what the market will actually bear, and that sellers who list aspirationally are the ones absorbing the correction, slowly, price cut by price cut.
Reading a Tanglewood listing before you write an offer
For a buyer working this market in the second half of 2026, the median is close to useless as a negotiating tool. What matters is where a specific listing sits relative to its own history and its own tier.
- Check whether the listing has been repriced, and how many times. A home still at its original ask after 60 or 90 days is a different conversation than one already down two rounds.
- Compare price per square foot against the last 90 days of new listings, not the trailing 12-month median. New-listing psf around $494 is a more current benchmark than a year-old closing average.
- Weigh lot size and documented recent improvements over architectural pedigree alone. Renovated systems and larger, more flexible land have held their footing better than pure design statements in this market.
- Treat 100 days as the realistic clock at the top of the market, not the 45 to 85 day range quoted for faster-moving segments closer to $2 million.
For a seller, the lesson runs the other direction. Pricing a Tanglewood estate against last year's headline median, rather than against what new listings are actually asking and getting today, is how a home ends up on its third price cut instead of its first offer.
FAQ
Is Tanglewood's market slowing down in 2026? It depends heavily on price tier. Homes closer to the $2 million mark appear to be moving in a more typical 45 to 85 day window, while listings above roughly $5 million are averaging closer to 100 days on market with real price concessions.
Why do different real estate sites show different medians for the same neighborhood? Tanglewood closes relatively few homes each month, so its median is sensitive to which specific properties happen to sell in a given reporting window. A single high-end estate closing can shift the reported median substantially without reflecting a broader trend.
Does a big price cut on one estate mean similar homes are equally negotiable? Not automatically. The Sturbridge Drive discount reflects a specific combination of an aspirational original ask and a long time on market. Properties with recent renovations, updated systems, and larger, more flexible lots have generally held their pricing better.
Tanglewood's reputation for stability is not wrong. What is wrong is treating any single quoted median as a live read on where that stability sits today. The more useful number is the one hiding in plain sight on a listing sheet: how long it has been active, how many times it has been repriced, and what comparable new listings are actually asking this month. If you are weighing a purchase or a sale in Tanglewood and want that read done specifically for your price tier, Ferguson Real Estate Consulting can walk through the current listing sheet with you line by line. Get in Touch.